Importance of Monitoring Kubernetes
Is it easy to monitor Kubernetes?
Kubernetes is designed to manage service-oriented applications using containers distributed across clusters of hosts. Kubernetes provides mechanisms for application deployment, scheduling, updating, service discovery and scaling. Kubernetes has taken the container ecosystem by storm and it is the brain for your distributed container deployment.
While Kubernetes has the potential to dramatically simplify the act of deploying your application in containers – and across clouds – it also adds a new set of complexities for your day-to-day tasks, managing application performance, gaining visibility into services, and your typical monitoring -> alerting -> troubleshooting workflow.
Legacy monitoring tools, collecting metrics from static targets, built for monitoring servers that you could name and services that didn’t change overnight, worked well past, but won’t work well today. This is why these tools fail at monitoring Kubernetes:
- Increase Infrastructure Complexity
New layers of infrastructure complexity are appearing in the hopes of simplifying application deployments: dynamic provisioning via IaaS, automated configuration with configuration management tools, and lately, orchestration platforms like Kubernetes, which sit between your bare metal or virtual infrastructure and the services that empower your applications. This is why monitoring the Kubernetes health at the control plane is part of the job.
- Scaling requirements and Cloud native explosionWhile we adopt cloud native architectures, the changes that they bring carry away an increased amount of smaller components. The number of metrics simply explodes and traditional monitoring systems just cannot keep up. While we used to know how many instances we had of each service component and where they were located, that’s no longer the case. Now, metrics have high cardinality. Kubernetes adds some multidimensional levels, like cluster, node, namespace or service, so the different aggregations or perspectives that need to be controlled can explode; many labels that represent attributes from the logical groups of the microservices, to application version, API endpoint, specific resources or actions, etc.
- Microservices Architecture
In addition to increased infrastructure complexity, new applications are being designed for microservices, where the number of components communicating with each other has increased in an order of magnitude. Each service can be distributed across multiple instances, and containers move across your infrastructure as needed. This is why monitoring the Kubernetes orchestration state is key to understanding if Kubernetes is doing its job. Trust but verify that all the instances of your service are up and running.In addition to increased infrastructure complexity, new applications are being designed for microservices, where the number of components communicating with each other has increased in an order of magnitude. Each service can be distributed across multiple instances, and containers move across your infrastructure as needed. This is why monitoring the Kubernetes orchestration state is key to understanding if Kubernetes is doing its job. Trust but verify that all the instances of your service are up and running.
Why is it important to monitor Kubernetes?
Kubernetes sits between your bare metal or virtual infrastructure and the services that run your apps. That’s why you need to monitor the health of the Kubernetes control plane. Kubernetes introduces all these new layers of infrastructure complexity. Service can be distributed across multiple instances. Containers are ephemeral and move across your infrastructure as needed.
Hence why monitoring the state of all resources is key to understanding if Kubernetes is doing its job.
It’s hard to see what happens inside of containers. Once a container dies the data inside it can never be recovered. You can’t see the logs after the fact making troubleshooting incredibly complicated. Monitoring tools need to be able to gather all the metrics and logs and store them in a safe, centralized location so you can access them at any point of time and troubleshoot issues.
What can we monitor ?
- Docker based pod specific metric – CPU, Memory, Throttling, restart count etc.
- Pod Related Metrics – Pod Status, container per pod, Container state, ready state etc
- Project level metrics – Total Namespaces, Total Nodes, Total Deployments, Total Pods etc
- Deployment metrics – Available Replicas, Deployment Health etc
- Node level metrics – Cpu Allocatable, Cpu Capacity, Disk Pressure, Memory Allocatable Etc
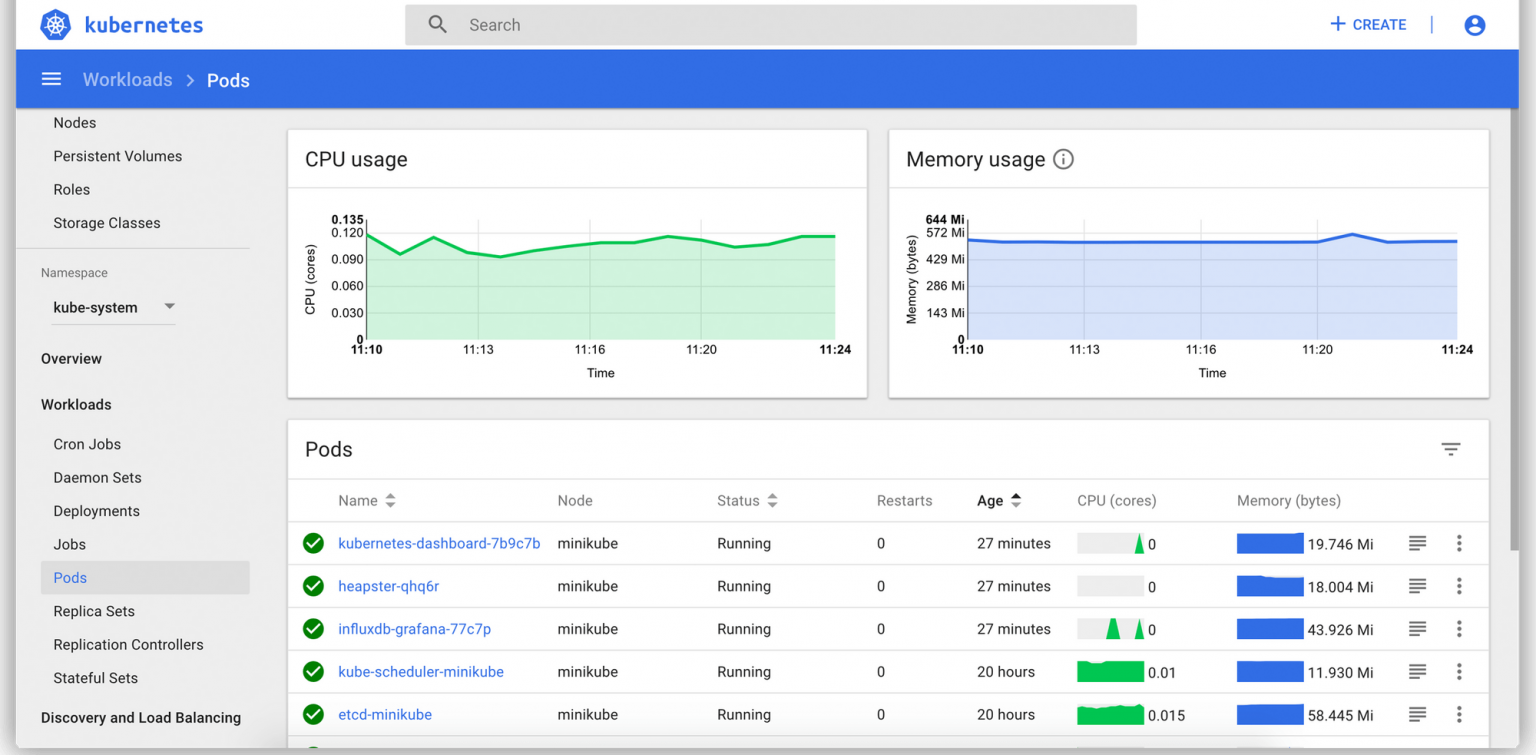
Kubernetes Dashboard